We analyzed 208,085 webpages to learn more about Core Web Vitals.
First, we established benchmarks for Cumulative Layout Shift, First Input Delay, and Largest Contentful Paint.
Then, we looked into the correlation between Core Web Vitals and user experience metrics (like bounce rate).
Thanks to data provided by WebCEO, we were able to uncover some interesting findings.
Let’s dive right into the data.
Here is a Summary of Our Key Findings:
1. 53.77% of sites had a good Largest Contentful Paint (LCP) score. 46.23% of sites had “poor” or “needs improvement” LCP ratings.
2. 53.85% of websites in our data set had optimal First Input Delay (FID) ratings. Only 8.57% of sites had a “poor” FID score.
3. 65.13% of analyzed sites boasted good optimal Cumulative Layout Shift (CLS) scores.
4. The average LCP of the sites we analyzed clocked in at 2,386 milliseconds.
5. Average FID was 137.74 milliseconds.
6. The mean CLS score was 0.14. This is slightly higher than the optimal score.
7. The most common issues impacting LCP were high request counts and large transfer sizes.
8. Large layout shifts were the #1 cause of poor CLS scores.
9. The most common issue affecting FID was an inefficient cache policy.
10. There was a weak correlation between Core Web Vital scores and UX metrics.
11. We did find that FID did tend to slightly correlate with page views.
53.77% of Websites Had an Optimal Largest Contentful Paint Score
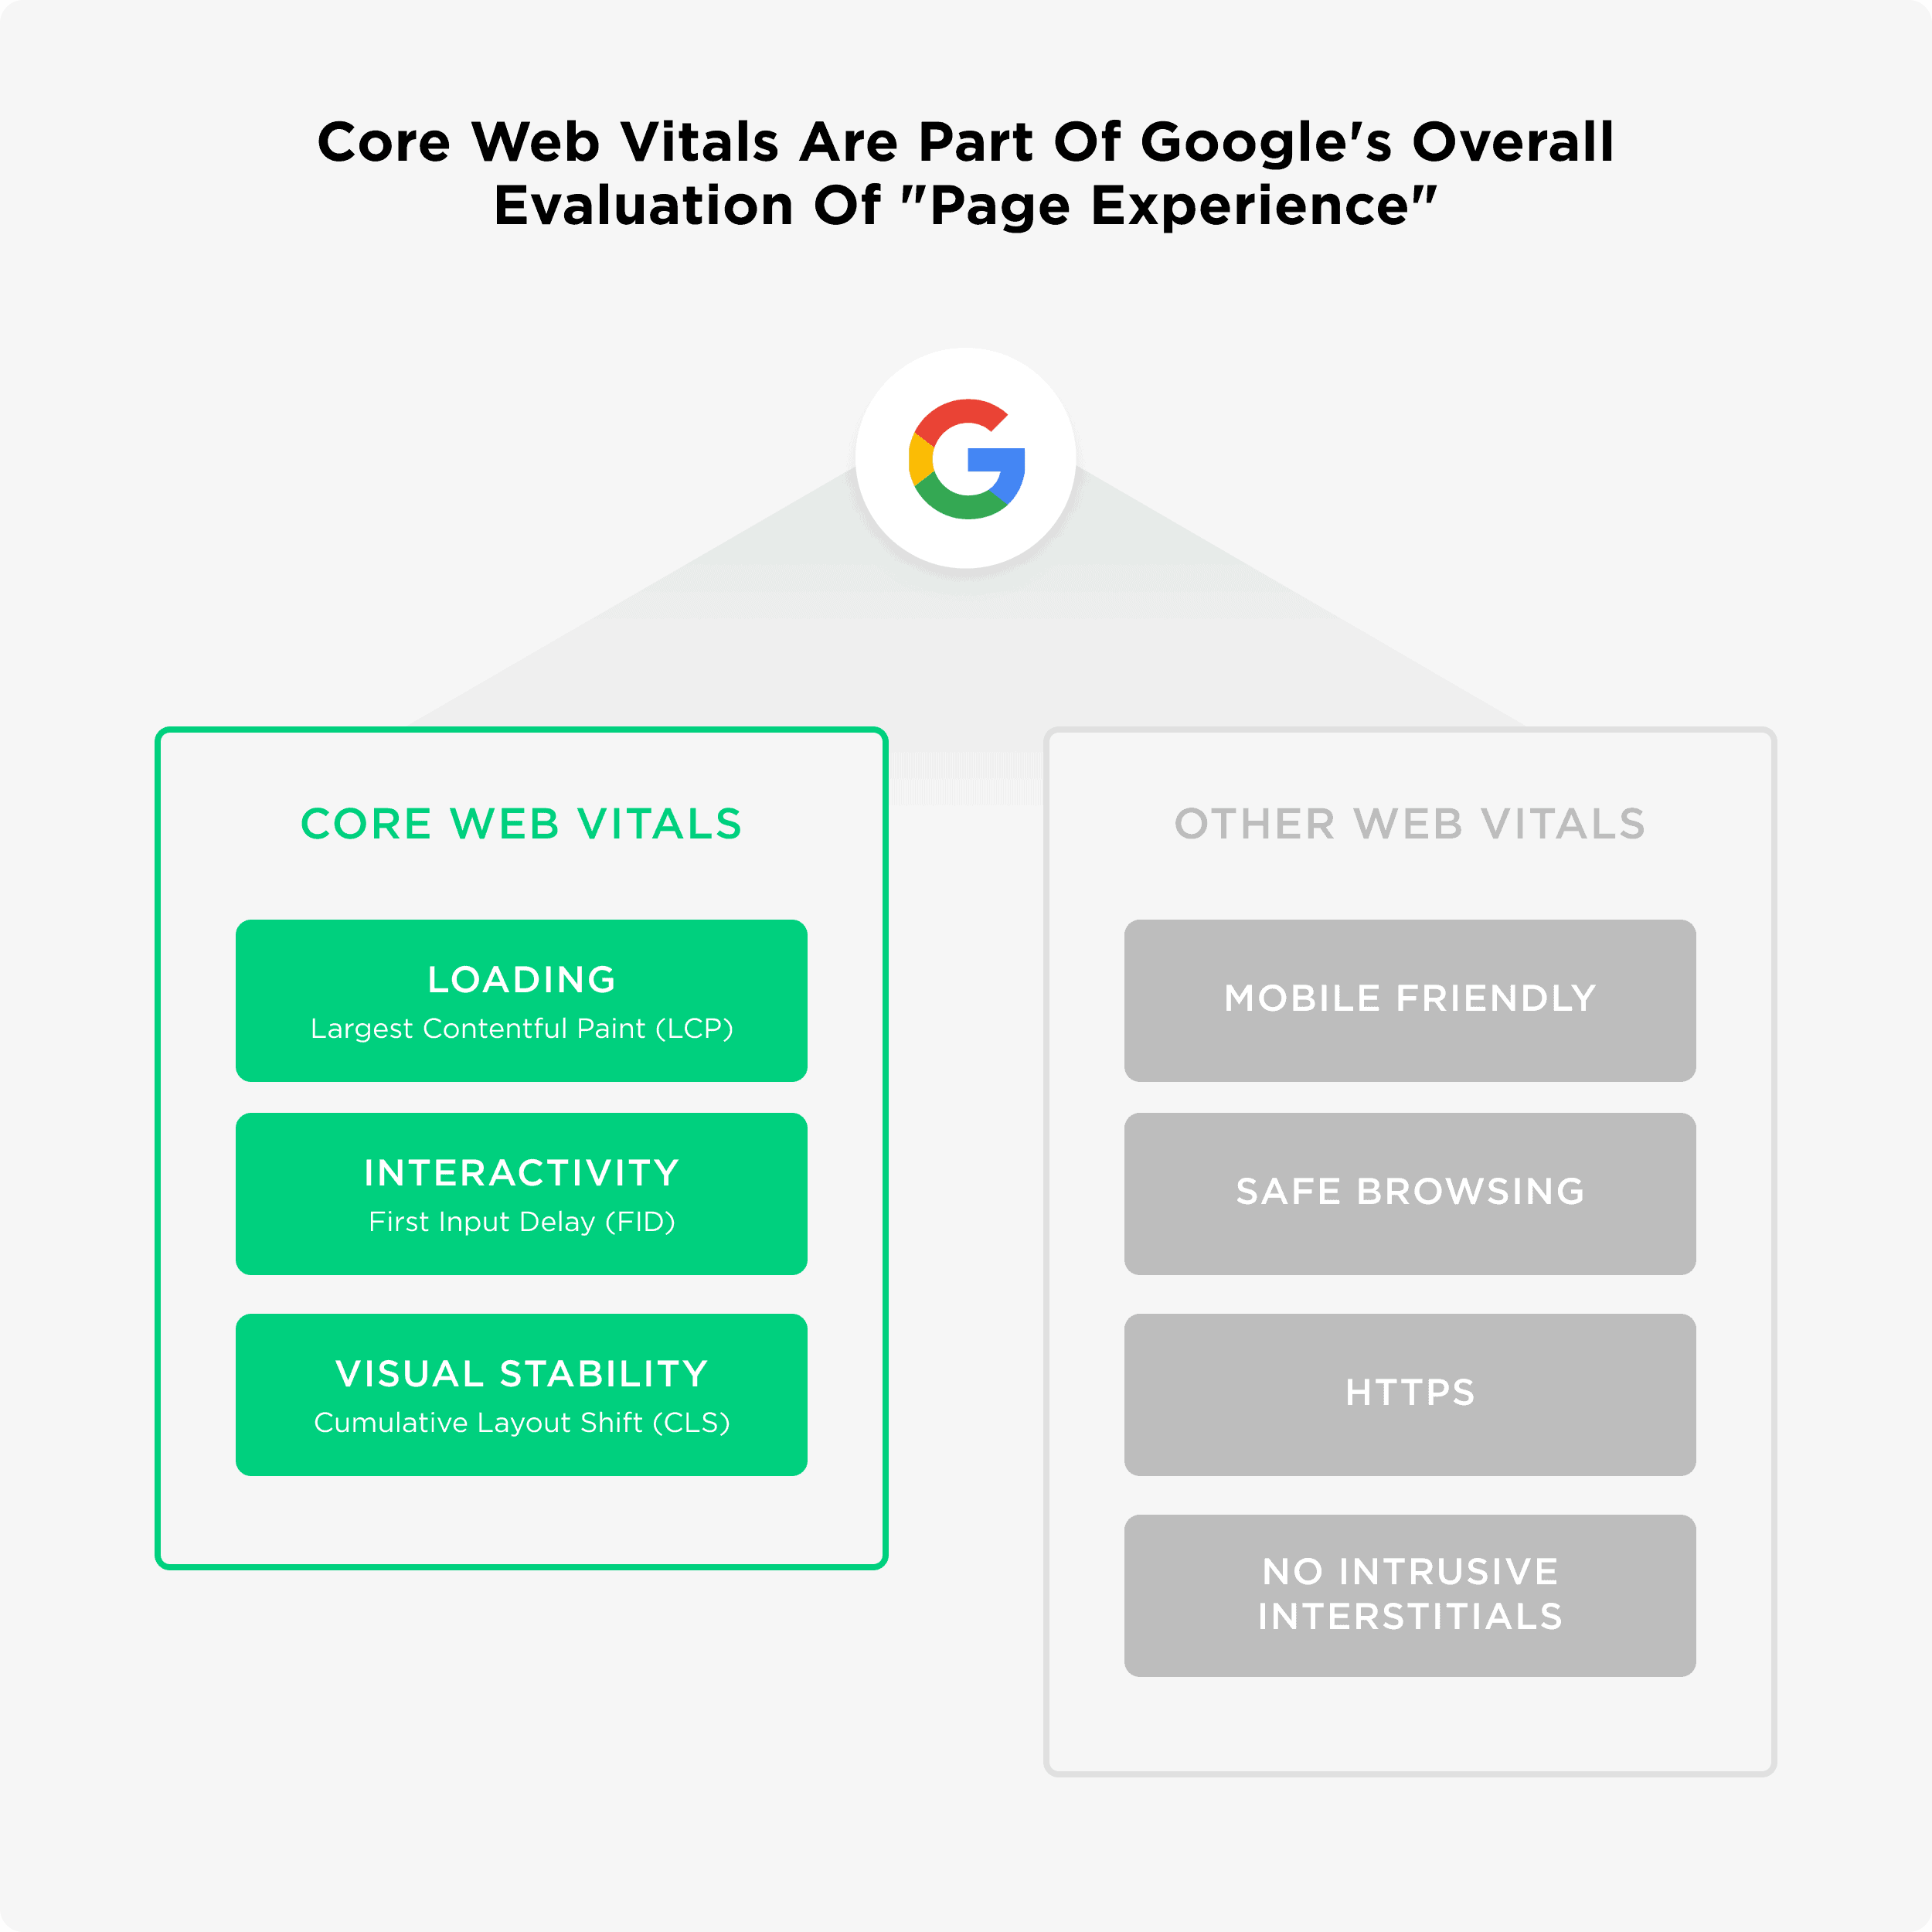
Our first goal was to see how each site performed based on the three factors that make up Google’s Core Web Vitals: Largest Contentful Paint, Cumulative Layout Shift, and First Input Delay.
Specifically, we wanted to determine the percentage of pages that were classified as “good”, “needs improvement” and “poor” inside of each site’s Search Console.
To do this, we analyzed anonymized Google Search Console data from 208k pages (approximately 20k total sites).
Our first task: analyze LCP (Large Contentful Paint). In simple terms, LCP measures how long it takes a page to load its visible content.
Here’s how the sites that we analyzed fared:

- Good: 53.77%
- Needs Improvement: 28.76%
- Poor: 17.47%
As you can see, the majority of sites that we looked at had a “good” LCP rating. This was higher than expected, especially when taking into account other benchmarking efforts (like this one by iProspect).
It may be that the websites in our dataset are especially diligent about page performance. Or it may be partly due to a sample size difference (the iProspect analysis continuously monitors 1,500 sites. We analyzed 20,000+).
Either way, it’s encouraging to see that only about half of all websites need to work on their LCP.
53.85% of Websites We Analyzed Had Good First Input Delay Ratings
Next, we looked at Search Console reported First Input Delay (FID) ratings. As the name suggests, FIP measures the delay between the first request and a user being able to input something (like typing in a username).
Here’s a breakdown of FID scores from our dataset:

- Good: 53.85%
- Needs Improvement: 37.58%
- Poor: 8.57%
Again, just over half of the sites we looked at had “good” FID ratings.
Interestingly, very few (8.57%) had “poor” scores. This shows that a relatively small number of sites are likely to be negatively affected once Google incorporates FID into their algorithm.
65.13% of Sites Had an Optimal Cumulative Layout Shift Score
Finally, we looked at the Cumulative Layout Shift (CLS) ratings from Search Console.
CLS is a measurement of how elements on a page move while loading. Pages that are relatively stable through the loading process have high (good) CLS scores.
Here were the CLS ratings among the sites that we analyzed:

- Good: 65.13%
- Needs Improvement: 17.03%
- Poor: 17.84%
Among the three Core Web Vitals scores, CLS tended to be the least problematic. In fact, only around 35% of the sites that we analyzed need to work on their CLS.
Average LCP Is 2,836 Milliseconds
Next, we wanted to establish benchmarks for each Core Web Vital metric. As mentioned above, Google has created their own set of guidelines for each Core Web Vital.
(For example, a “good” LCP is considered to be under 2.5 seconds.)
However, we hadn’t seen a large-scale analysis that attempted to benchmark each Core Web Vital metric “in the wild”.
First, we benchmarked LCP scores for the sites in our database.
Among the sites that we analyzed, the average LCP turned out to be 2,836 Milliseconds (2.8 seconds).

Here were the most common issues that negatively impacted LCP performance:

- High request counts and large transfer sizes (100% of pages)
- High network round-trip time (100% of pages)
- Critical request chains (98.9% of pages)
- High initial server response time (57.4% of pages)
- Images not served in next-gen format (44.6% of pages)
Overall, 100% of pages had high LCP scores at least partly due to “High request counts and large transfer sizes”. In other words, pages that are heavy with excess code, large file sizes, or both.
This finding is in line with another analysis that we did which found that large pages tended to be the culprit behind most slow-loading pages.
Average FID Is 137.4 Milliseconds
We then looked at FID scores among the pages in our dataset.
Overall, the mean First Input Delay was 137.4 milliseconds:

Here are the most prevalent FID-related issues that we discovered:

- Inefficient cache policy (87.4% of pages)
- Long main-thread tasks (78.4% of pages)
- Unused JavaScript (54.1% of pages)
- Unused CSS (38.7% of pages)
- Excessive Document Object Model size (22.3% of pages)
It was interesting to see that caching issues tended to negatively affect FID more than any other problem. And, not surprisingly, poorly-optimized code (in the form of unused JS and CSS) was behind many high FID scores.
Average CLS Is .14
We discovered that the average CLS score is .14.

This metric specifically looks at how the content on a page “shifts”.Anything below .1 is rated as “good” in Search Console.
The most common issues affecting the projects’ CLS included:

- Large layout shifts (94.5% of pages)
- Render-blocking resources (86.3% of pages)
- Text hidden during web font load (82.6% of pages)
- Not preloaded key requests (26.7% of pages)
- Improperly sized images (24.7% of pages)
How LCP Correlates With User Behavior
Now that benchmarks were set, we then set to find out how accurately Core Web Vitals represent real-life user experience.
In fact, this relationship is something that Google themselves highlight in their “Core Web Vitals report” documentation:

To analyze Core Web Vitals and their impact on UX, we decided to look at three UX metrics designed to represent user behavior on webpages:
- Bounce rate (% of users leaving a website’s page upon visiting it)
- Page depth per session (how many pages users see before leaving the website)
- Time on website (how much time users spend on a website in a single session)
Our hypothesis was as follows: if you improve a website’s Core Web Vitals, it will positively affect UX metrics.
In other words, a site with “good” Core Web Vitals will have a lower bounce rate, longer sessions, and higher page views. Fortunately, in addition to Search Console data, this data set also contained UX metrics from Google Analytics.
Then, we simply had to compare each website’s Core Web Vitals against each UX metric. You can find our results for LCP below:
LCP and Bounce Rate

LCP and Pages per Session

LCP and Time on Site

On the three graphs, it was clear that all three different segments (Good, Poor and Needs Improvement) are somewhat evenly distributed on the graph.
In other words, there wasn’t any direct relationship between LCP and UX metrics.
FID Has a Slight Relationship With Page Views
Next, we looked at the potential relationship between First Input Delay and user behavior.
Like with LCP, it’s logical that a poor FID would negatively impact UX metrics (especially bounce rate).
A user that needs to wait to choose from a menu or type in their password is likely to become frustrated and bounce. And if that experience carries across several pages, it may lead to them reducing their total page views.
With that, here’s how FID correlated with their behavioral metrics.
FID and Bounce Rate

FID and Pages per Session

Note: We found that a high FID tends to correlate with a low number of pages per session. The opposite was also true.
FID and Time on Site

Overall, the only instance where we see hints of correlation is when we compare FID to the number of pages viewed per session. When it comes to bounce rate and time on site, a website’s FID appears to have no influence on user behavior.
How CLS Impacts User Behavior
Next, we wanted to investigate a potential link between CLS and user activity.
It seems logical that a poor CLS would frustrate users. And could therefore increase bounce rate and reduce session time.
However, we weren’t able to find any case studies or large-scale analysis that demonstrated that high CLS scores influence user behavior. So we decided to run an analysis that looked for potential relationships between CLS, bounce rate, “dwell time” and pages viewed. Here’s what we found:
CLS and Bounce Rate

CLS and Pages per Session

CLS and Time on Site

Overall, we didn’t see any significant correlation between CLS, bounce rate, time on site, or page views.
Summary
I hope you found this analysis interesting and useful (especially with Google’s Page Experience update on the way).
Here’s a link to the raw data set that we used. Along with our methods.
I want to thank SEO software WebCEO for providing the data that made this industry study possible.
Overall, it was interesting to see that most of the sites that we analyzed performed relatively well. And are largely ready for the Google update. And it was interesting to find that, while Core Web Vitals represent metrics for a positive UX on a website, we didn’t see any correlation with behavioral metrics.
Now I’d like to hear from you:
What’s your main takeaway from today’s study? Or maybe you have a question about something from the analysis. Either way, leave a comment below right now.